|
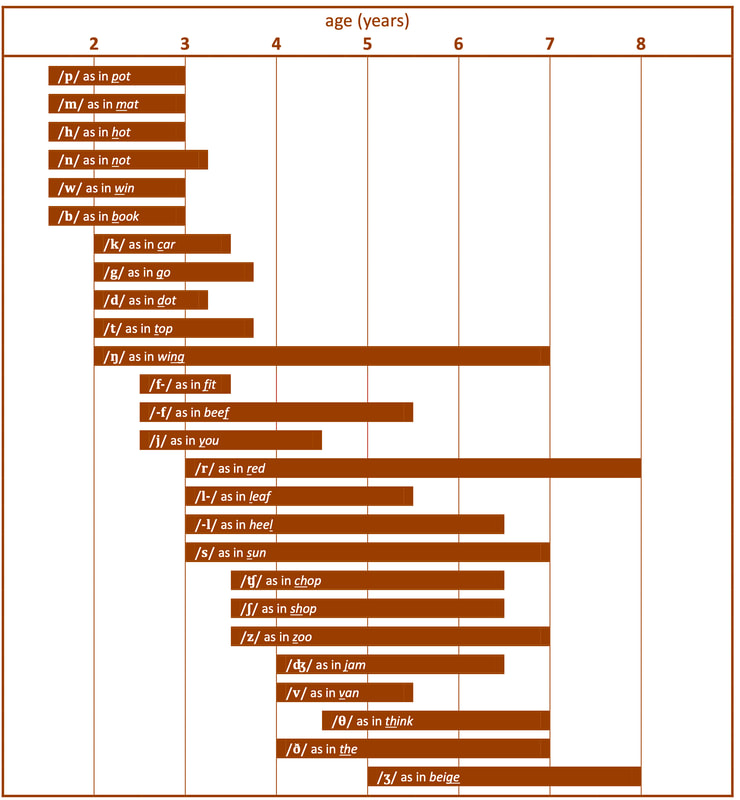
How do we know if a child will “outgrow” a developmental speech problem? The truth is we don’t know. Speech is such a complicated miracle of life which involves the coordination of multiple areas of the brain, multiple mouth and facial muscles, as well as coordination of the respiratory system and the vocal tract. There are simply too many places where the coordination might have a “hiccup.” Other factors that affect “knowing” whether a misarticulation will resolve itself includes the diversity of human beings. There are simply too many variables to neatly determine in a laboratory how a child will perform the multitude of mental, motor, and social tasks necessary to have coherent and easy conversation. Some of the cues that we have in available to us in assessing a child’s speech development are charts that plot the “typical” development of speech in English speaking children. However, it is important to understand these charts and what they truly mean. Often times, I find that even professionals who work with children, such as pediatricians and early education teachers, misunderstand what these charts mean. Here in lies an explanation: The chart below is often used as a measure of how a child is doing in speech acquisition. Often times the parent is shown the bar for the /r/ and told: yes, their seven-year-old son has no /r/ at all but since we don’t expect /r/ to come until age 8 it’s okay to wait before intervening. However, let me put this another way. This chart shows that 50% of children master /r/ at age 3 and 90% MASTER /r/ at age 8. This is distinctly different than 50% of the time, or having the initial position, or not having started saying /r/. Mastery means they can have a conversation without the listener thinking, “Aw, he still sounds so cute, like a toddler.” Simply put, according to our best evidence it is not typical at all for a child to struggle with a sound, even one as tricky as an /r/, at age 8. The chart represents combined data from Sander (1972), Grunwell (1981) and Smit et al. (1990). The left-hand edge of each horizontal bar represents the age at which 50% of children produce the particular consonant correctly and use it in their speech. The right-hand edge of each horizontal bar represents the age at which 90% of children have mastered the use of the particular consonant in their speech. Of course, the next problem is what should you do about it, as a parent, grandparent, loved one? Does the /r/ issue negatively impact his ability to obtain a Free and Appropriate education? The school is going to tell you no because, frankly, they have kids with bigger problems, and speech pathologists have obscene workloads. Your insurance company is either going to tell you that this will be dealt with by the school, or the Medical Directors, who are by and large doctors not speech specialists, don’t have the expertise to realize that this is not normal.
What do parents do then? Advocate for your child, by bringing research, and correcting administrators or anyone else who tries to interpret the speech acquisition charts incorrectly. Point out that the even a lack of significant direct impacts evident in the child’s education, does not mean there are no problems. Research shows that more problems with speech often translates into literacy problems. And of course, there is a social toll. Luckily there are public figures with the occasional lisp, whistle, or /r/ labializations, however any problems in articulation will have a negative social impact on the child as he ages. Be sure to advocate with your school, your doctors, or your other care teams to ensure your child gets the help he needs, when he needs it.
0 Comments
Your comment will be posted after it is approved.
Leave a Reply. |
Trissa DiBenedetto WAlterIs a singer, voice teacher, speech language pathologist, and certified vocologist Archives
July 2020
Categories |

 RSS Feed